Manufacturing in Los angeles employees over 660,000 people, this is second to the service industry, which employees almost 1.5 million people. In the table below from the L.A Almanac it shows the number of different industries and the amount of people employed in each.
Business Establishments, Employment and Payroll
Los Angeles County, 1997
All Industries
|
 According to figures compiled by the U.S. Conference of Mayors, if Los Angeles County, with a gross metropolitan product of $410.8 billion in 2003, were a separate nation, it would rank 14th in the world for gross product. Its gross economic output in 2003 was larger than that of either Australia, the Netherlands, Russia, Taiwan, Switzerland, Sweden, Belgium, Austria, Saudi Arabia, or Norway. Los Angeles County ranks second
nationally only to New York City ($488.8 billion in 2003).

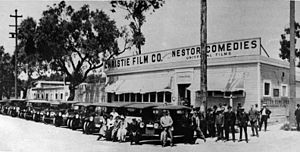
The movie industry employees over 160,000 people in the L.A. Region, these jobs can range from a Producer/Director to the ticket handler at your local theater.
What's crazy about the table below is how many households in Los Angeles have an income of less than $10,000 annually. The average median household income 1999 was $42,189.
Household Income
Los Angeles County Households, 1999
Household Income
|
Households
|
Percent
|
Total Households
|
3,136,279
|
100.00%
|
Less than $10;000
|
330,000
|
10.52%
|
$10;000 to $14;999
|
203,819
|
6.50%
|
$15;000 to $19;999
|
196,731
|
6.27%
|
$20;000 to $24;999
|
201,561
|
6.43%
|
$25;000 to $29;999
|
191,887
|
6.12%
|
$30;000 to $34;999
|
189,179
|
6.03%
|
$35;000 to $39;999
|
169,484
|
5.40%
|
$40;000 to $44;999
|
162,317
|
5.18%
|
$45;000 to $49;999
|
140,505
|
4.48%
|
$50;000 to $59;999
|
253,707
|
8.09%
|
$60;000 to $74;999
|
304,843
|
9.72%
|
$75;000 to $99;999
|
318,521
|
10.16%
|
$100;000 to $124;999
|
181,732
|
5.79%
|
$125;000 to $149;999
|
95,240
|
3.04%
|
$150;000 to $199;999
|
87,864
|
2.80%
|
$200;000 or more
|
108,889
|
3.47%
|
Sources:
LA Almanac
http://www.laalmanac.com/


